Reflector monitoring
This module performs measurement extraction for all reflectors in a network, computes Absolute Positioning Errors (APE), Radar Cross Section (RCS), Signal-to-Clutter Ratio (SCR) and generates reports and plots.
This module assumes you have already prepared SLC stacks of your AOI using SNAP, see SNAP processing.
The analysis runs automatically on the network-specific station log-files prepared by user in .json format.
Note
Co-registration is not needed for operational monitoring of the reflectivity and positioning accuracy.
Analysis runs on the slaves directory.
Station log-files
Template station log-files:
Note
Contents of reflectors.json and stacks.json can be merged into a single file.
For networks containing many reflectors, csv input format can be used instead:
The geometry parameters of corner reflectors are explained in Corner reflector geometry.
Time series analysis
Prepare input parameters file gecoris.parms:
{
"project" : 'PEM2',
"stationLog" : '/home/rc/CR_Partizanske/reflectors.json',
"stackLog" : '/home/rc/CR_Partizanske/stacks.json',
"outDir" : '/home/rc/CR_Partizanske/gecoris/',
"precisePosFlag" : 1,           # 0 = approx. / 1 = precise positioning
"plotFlag" : 1,                 # 0 = no plots / 1 = sparse plots / 2 = detailed plots
"atmoFlag" : 0,                      # 0 / 1 = use external models for atmo. delay correction
"ovsFactor" : 32                # FFT oversampling factor
}
Reflector class capabilites
Once you run the time series analysis, all extracted data are stored in instances of Reflector class.
Each instance contains list of stacks (reflector.stacks).
Let’s find the index of a specific stack and look at its data:
reflectors[0].getStackIdx('s1_dsc51')
>> 0
reflectors[0].stacks[0]['data']
Now print the stats for this stack:
reflectors[0].getStackStats('s1_dsc51')
Or just print all time series for all the stacks:
reflectors[0].get_all_timeseries()
Making plots and reports
Single reflector
First, let’s plot the radar cross section (RCS) time series of single reflector:
reflectors[0].plotRCS()

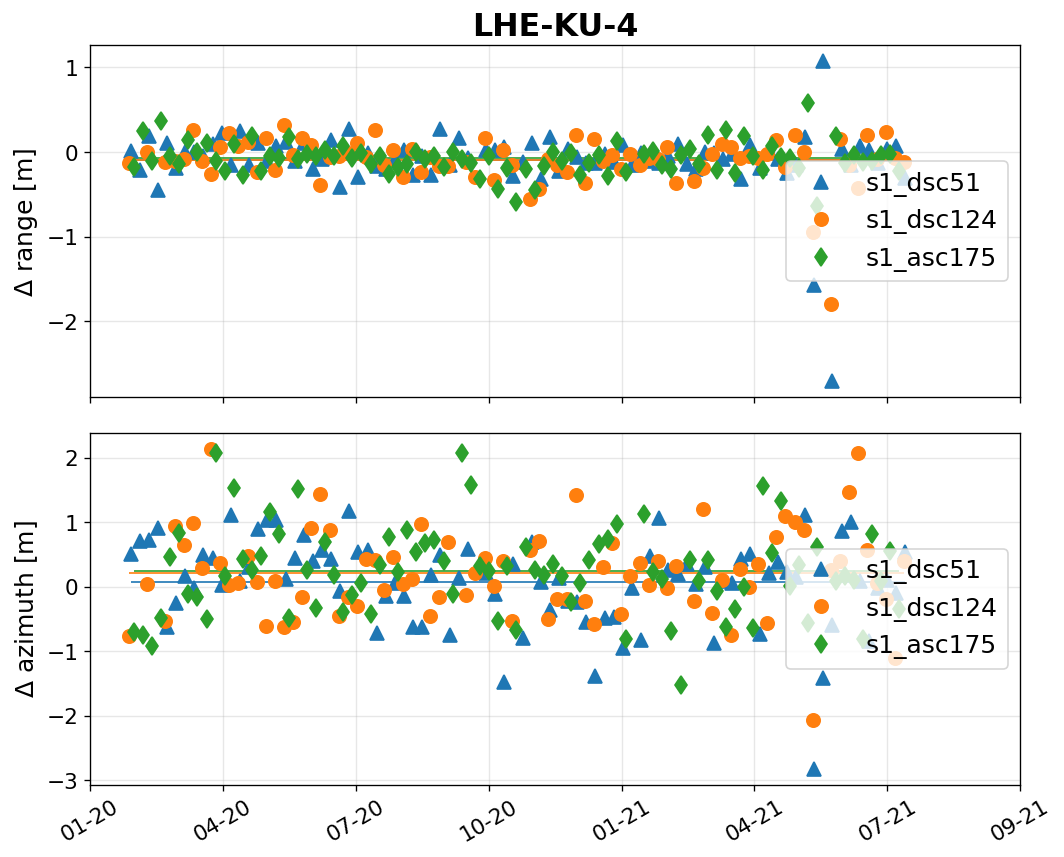
Similarly, one can plot the absolute positioning errors (APE) time series:
reflectors[0].plotALE_TS()
Now we export the stats to JSON:
reflectors[0].statsToJSON('/data/output/')
/data/output/LHE-KU-4_stats.json:
{
  "s1_dsc51": {
    "reflRCS": 32.81868591234495,
    "SCR": 23.70038818940449,
    "sigRCS": 0.3148330657079924,
    "clutRCSbefore": 9.500978820219451,
    "clutRCSafter": 9.118297722940458,
    "sigPhi_DA": 0.00020351132022353085,
    "sigPhi_SCR": 0.00020383591011901035,
    "azimuthCRB": 0.5527594433637688,
    "rangeCRB": 0.08936829323845362,
    "azimuthSTD": 0.6778552357079567,
    "rangeSTD": 0.38369251256879244,
    "azimuthALE": 0.06533686251683654,
    "rangeALE": -0.08902981820298544,
    "RCS0": 33.44776029342321
  },
  "s1_dsc124": {
    "reflRCS": 33.2221641710527,
    "SCR": 23.32817882820653,
    "sigRCS": 0.32864918848519836,
    "clutRCSbefore": 10.043578676576876,
    "clutRCSafter": 9.893985342846165,
    "sigPhi_DA": 0.0002123896783475315,
    "sigPhi_SCR": 0.00021276057965773464,
    "azimuthCRB": 0.5782900320352186,
    "rangeCRB": 0.0698944294233743,
    "azimuthSTD": 0.6762300255906063,
    "rangeSTD": 0.2803157149530284,
    "azimuthALE": 0.2052737931180985,
    "rangeALE": -0.09605003170513007,
    "RCS0": 33.126594819812844
  },
  "s1_asc175": {
    "reflRCS": 33.21045649400904,
    "SCR": 23.49841920818314,
    "sigRCS": 0.3222575243995891,
    "clutRCSbefore": 8.437444160018636,
    "clutRCSafter": 9.712037285825897,
    "sigPhi_DA": 0.00020828326339198585,
    "sigPhi_SCR": 0.00020863114707974089,
    "azimuthCRB": 0.5704539057674874,
    "rangeCRB": 0.08052547139431412,
    "azimuthSTD": 0.6772918998470858,
    "rangeSTD": 0.18446497948817264,
    "azimuthALE": 0.23605451279970796,
    "rangeALE": -0.07616969436924195,
    "RCS0": 33.56157353616145
  }
}
Reflector network
Having a network of reflectors, one can make overall plots using gecoris.plotUtils:
from gecoris import plotUtils

plotUtils.plotNetworkALE(stations, 'network_ALE.png')
plotUtils.plotNetworkRCS(stations, 'network_RCS.png')
plotUtils.plotNetworkSCR_hz(stations, 'network_SCR.png')


